Does anybody know what the Plot function does? The user manual gives an explanation for PlotPhase, and syntax for PlotOn, PlotOff and PlotChange, but the only mention of Plot is where to the command is. I am asking because I am trying to debug a program that makes heavy use of this command.


Plot function
Started by
Toasterit
, Nov 29 2016 02:14 AM
1 reply to this topic
#2

Krtyski
-

- Members
-

- 132 posts
Casio Freak
- Gender:Male
- Location:Tokyo, Japan
- Interests:programming, smooth Jazz and 4-wheel driving.
-
Calculators:
FX-502P, FX-602P, FX-603P,
fx-4000P, fx-7000G,
fx-4500P, fx-4800P
fx-5800P,
CFX-9850G,
CFX-9850GC PLUS
fx-9860G,
fx-9860G AU,
fx-9860G Slim
fx-9860GII SD,
fx-9860GII-2,
fx-9860GII-2 SD,
fx-CG20, fx-CG50,
fx-CP400
fx-9860GIII
fx-9750GIII
fx-7400GIII
Posted 29 November 2016 - 09:23 AM
I do not have fx-9750GII but have fx-9860GII. I think the Plot command works same, so let me tell you about Plot command with fx-9860GII.
At first try following code;
File name: PLOT2.1
ClrGraph
CoordOff
GridOff
AxesOff
LabelOff
Plot 1,0
Note, you use CoordOff, not CoordOn.
Probably you know PlotOn 1,0 draw a dot at coordinate (1, 0). So what does Plot 1,0 draw?
Run the code , then you get following result.
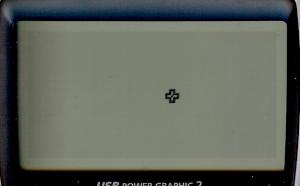
A cross hair cursor comes and brink in screen.
You can move the cursor using arrow keys. When you mode the cursor, what do you see?
There is no dot drawn, just the cursor is moved.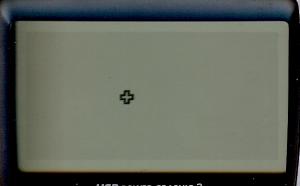
Now you know that Plot 1,0 just display cursor without drawing dot.
Then push key, 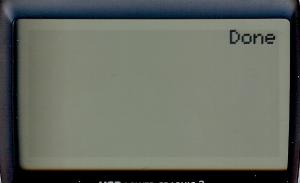
switched to text screen and then Done is shown.
In order to switch to graphics screen, press (G↔T),
graphics screen comes back with the moved cursor.
Then again move the cursor, then what do you see?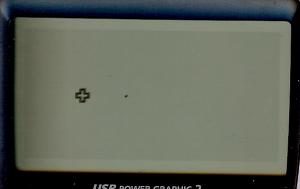
at this time you see dot!
Plot 1,0 display cross hair cursor, and press key, then you finally get a dot.
Plot <x coordinate>,<y coordinate>
display cursor, does not draw dot. Press key after the cursor is coming then draw dot. This is most different function from PlotOn command.
Run PLOT2.1 code and
mode cursor
⇓
Press key
⇓
Press (G↔T) to switch to graphics screen
⇓
move cursor
⇓
・
・
・
Repeating this, you can draw multiple dots.
==========
Change the second line of the code (CoordOff) to CoordOn, gives new name to the code;
File name: PLOT2.2
ClrGraph
CoordOn
GridOff
AxesOff
LabelOff
Plot 1,0
Run this;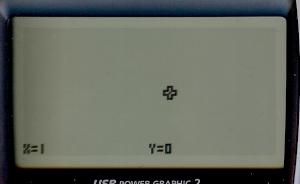
You will see X and Y coordinate values in the bottom line.
Use Plot command with CoordOn setting, you get coordinate value displayed. This is also different function from PlotOn and now you know Plot command works differently by CoordOn/Off setting.
Move the cursor, then the displayed coordinate values change.
Press to switch to graphics screen, then move the cursor,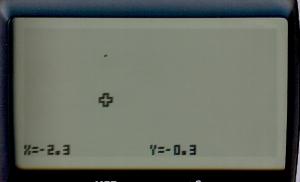
You see a dot.
==========
it is annoying to switch to graphics screen every time, you will try run Plot 1,0 repeatedly,
Try this;
Fine name: PLOT2.3
ClrGraph
CoordOn
GridOff
AxesOff
LabelOff
While 1
Plot 1,0
WhileEnd
Using While / WhileEnd loop, to repeat Plot 1,0 .
Run this,
At this time, cross hair cursor does not come up, but draw a dot at (1, 0). Why the cursor does not come up?
Before Casio Basic system hands over control from Plot command, the cursor is not displayed.
Make the following code by ◢ command to hand over control from Plot to ◢ ;
Fine name: PLOT2.4
ClrGraph
CoordOn
GridOff
AxesOff
LabelOff
While 1
Plot 1,0◢
WhileEnd
Run this, 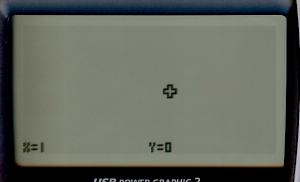
cursor comes, then you can move the cursor as you like. Press key then plot a dot. The dot is hided by cursor, but you can see the dot when the cursor is moved.
As ruing the while loop, cursor comes back on (1, 0). This behavior is as code of Plot 1,0◢ , no question about this.
=====
Try this;
File name: PLOT2.5
ClrGraph
CoordOn
GridOff
AxesOff
LabelOff
0→X:0→Y
While 1
Plot X,Y◢
Text 1,1,"x= " (4 spaces)
Text 1,35,"y= " (5 spaces)
Text 1,10,X
Text 1,45,Y
WhileEnd
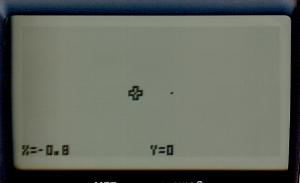
Runs this, cursor comes on (0, 0) at first;
Move cursor and press key where you want to plot a dot;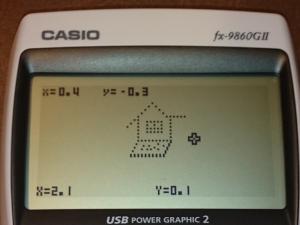
This code shows X and Y values for further understanding how Plot command works.
Edited by Krtyski, 03 December 2016 - 03:20 PM.
Created image links
1 user(s) are reading this topic
0 members, 1 guests, 0 anonymous users

